For tax professionals and online sellers: Quickly find answers to questions about your data | Transaction Data – detailed view
This is where Taxdoo comes in, introducing our new feature “Transaction Data – Detailed View”.
This powerful addition to the Taxdoo dashboard is designed to help tax professionals and online sellers quickly find answers to questions about their data, eliminating the need for manual data analysis and reducing the risk of costly errors.
Pain Points Addressed:
- Difficulty in tracking and analysing transaction data from multiple sources, leading to potential errors and time-consuming manual work.
- Inability to easily identify trends and outliers in net revenue and taxes, hindering decision-making and strategic planning.
- Limited understanding of how aggregated numbers are calculated, causing confusion and potential misinterpretation of financial data.
With Taxdoo’s “Transaction Data – Detailed View” you can:
- Easily visualise net revenue and tax trends using graphs, allowing for better decision-making and insights into business performance.
- Quickly spot outlier periods, enabling proactive measures to address potential issues or capitalise on opportunities.
- Gain a clear understanding of transaction types and how calculations are performed, reducing confusion and increasing accuracy.
- Effortlessly dive deeper into transaction-level data, using filters such as period, country of taxation, type of transaction, and VAT rate to focus on specific areas of interest.
Going deep into the Taxdoo dashboard
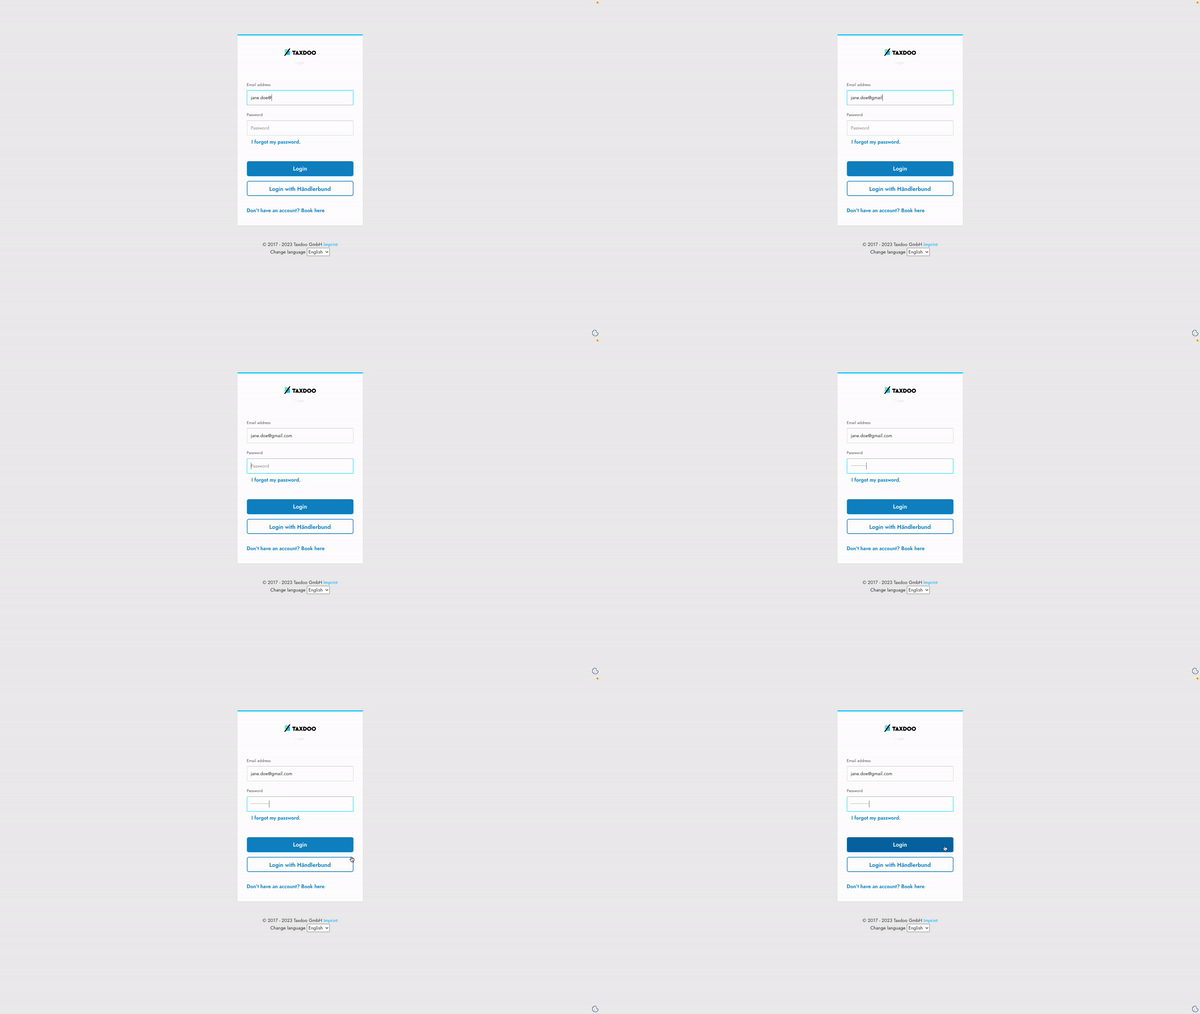
Step 1: Login
Log in to your dashboard with your username and password.
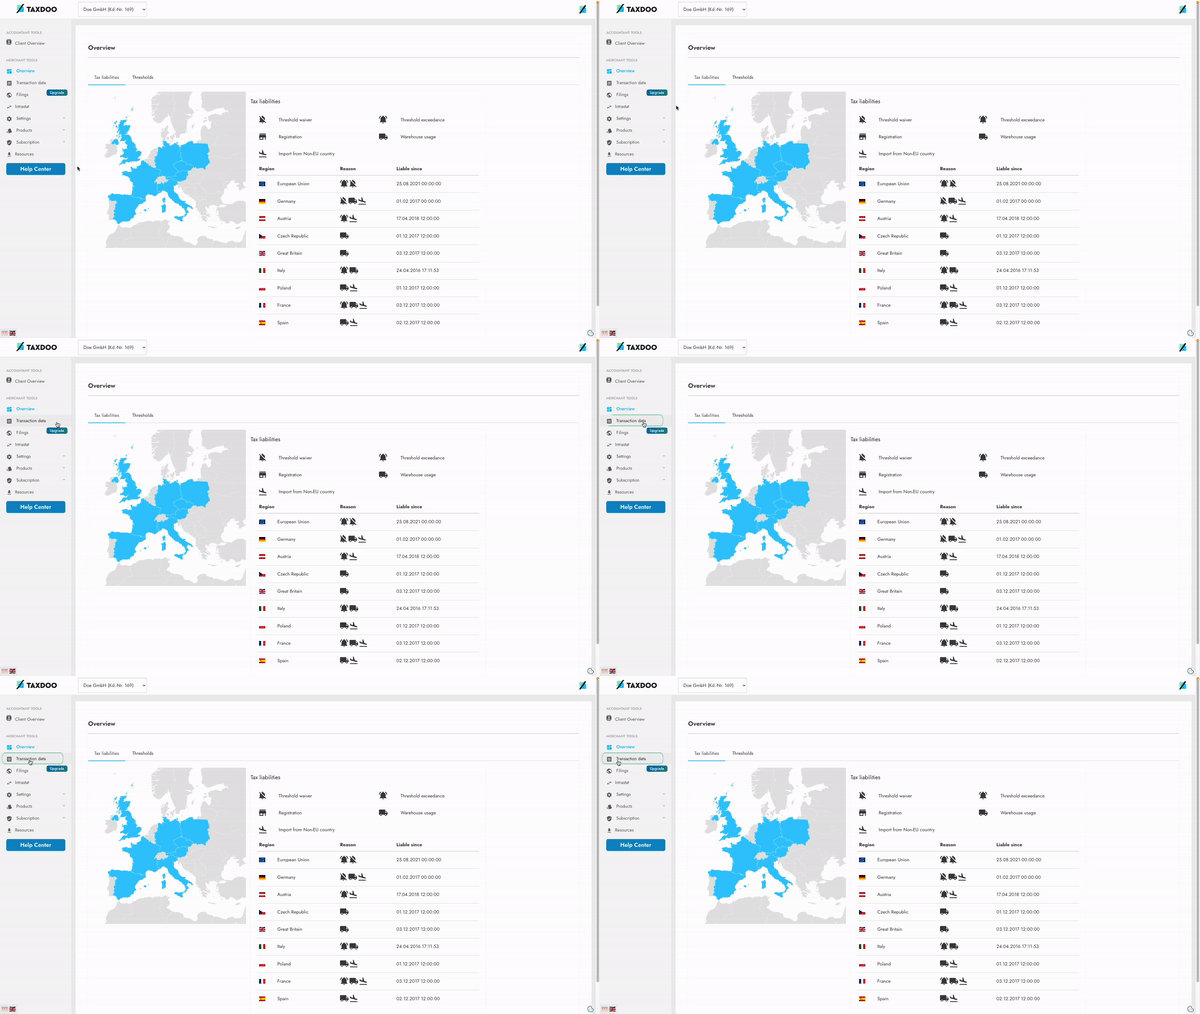
Step 2: Transaction data section
Once you are logged in to your dashboard, go to Transaction data.
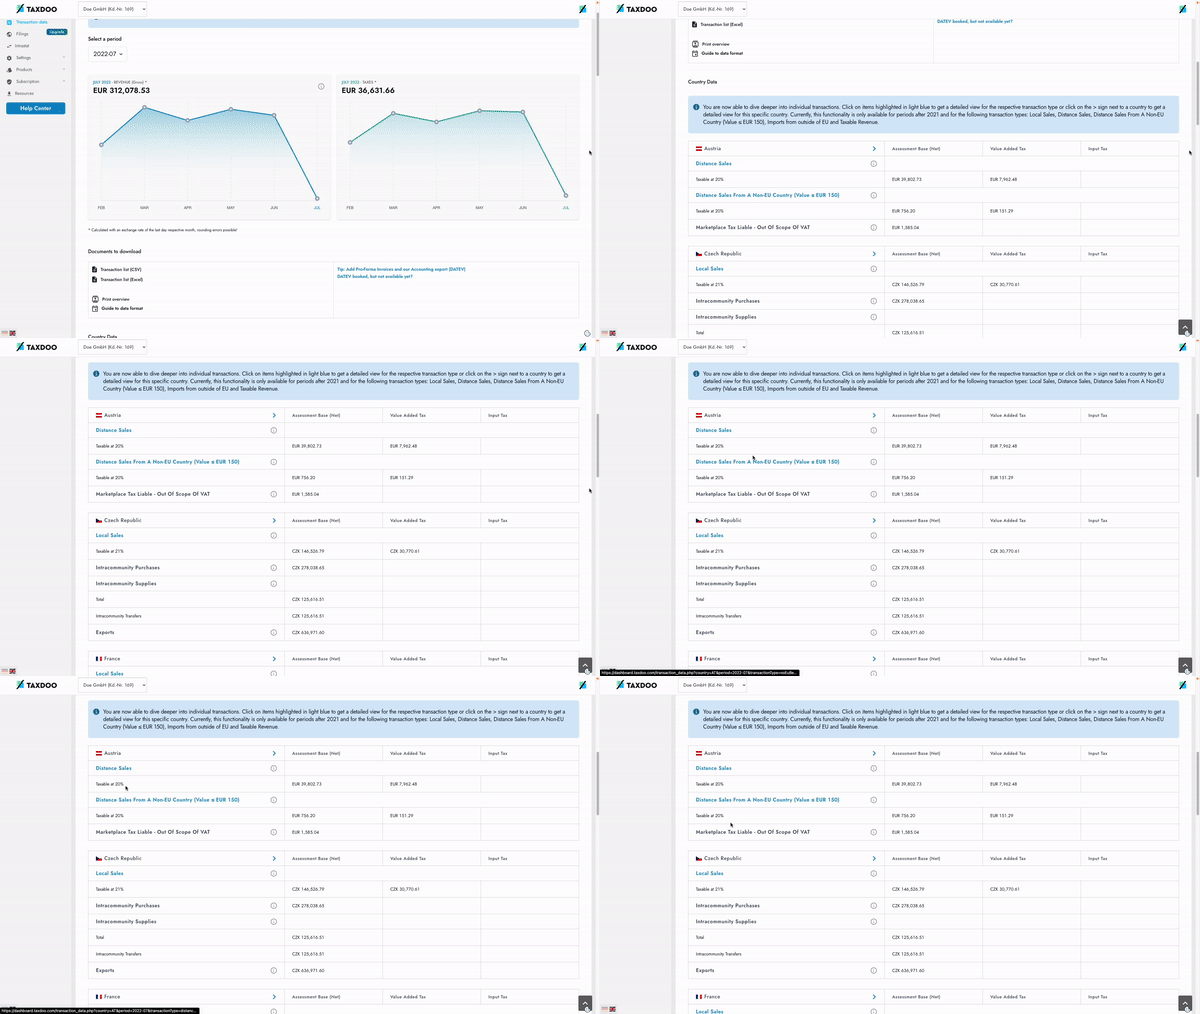
Step 3: Select the country
In order to get to the ‘Detailed view’, in the country data subsection, select the country or transaction type.
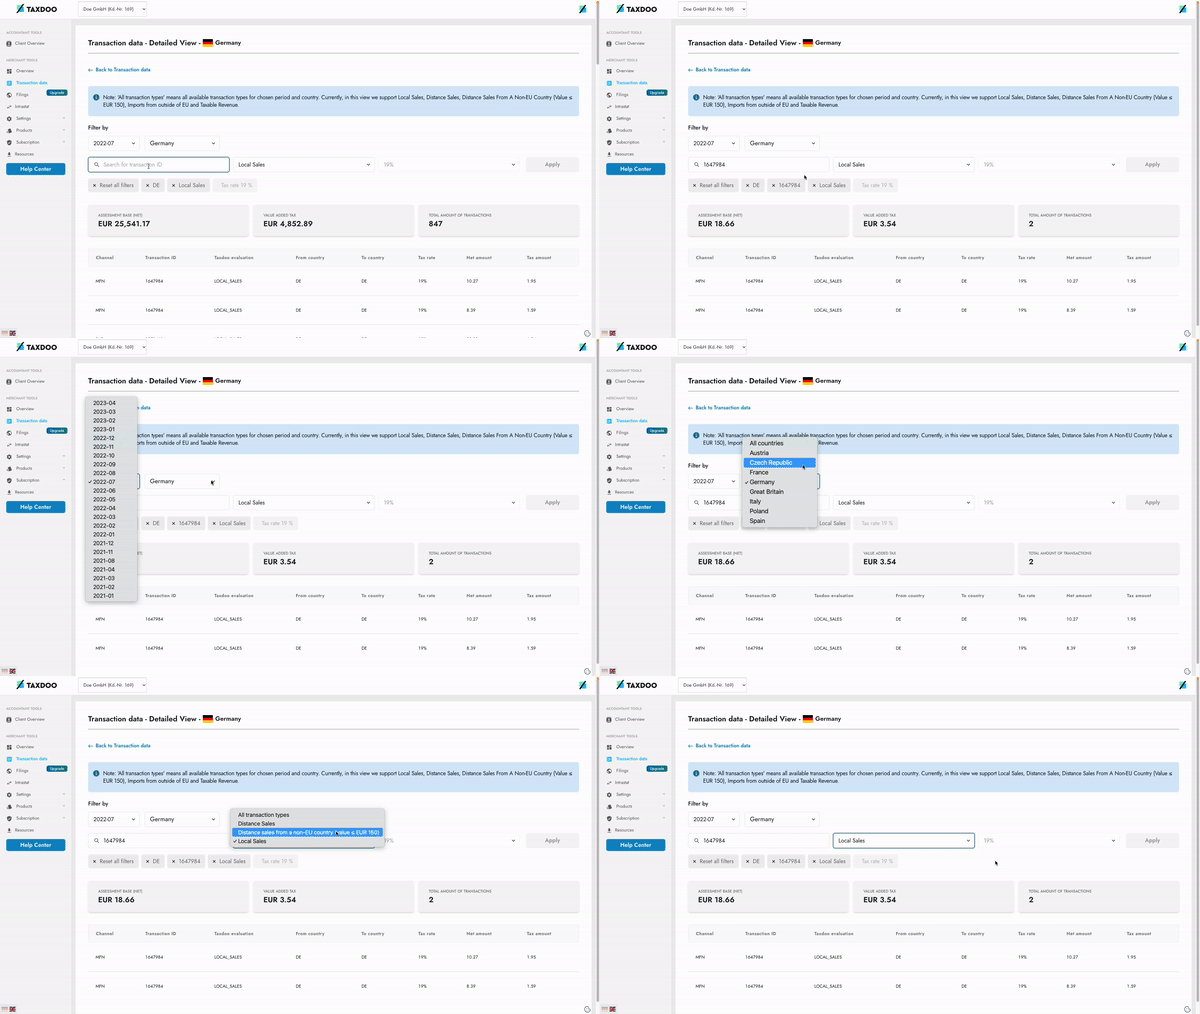
Step 4: Going through the filters
With this new tool you will have the ability to dive deeper from aggregated view to transaction level view, understand how aggregated figures are calculated on the basis of individual transactions, and quickly obtain more aggregated information using various filters, such as:
- Period
- Country of taxation
- Type of transaction
- VAT rate.
- You can also search for a specific transaction by transaction ID.
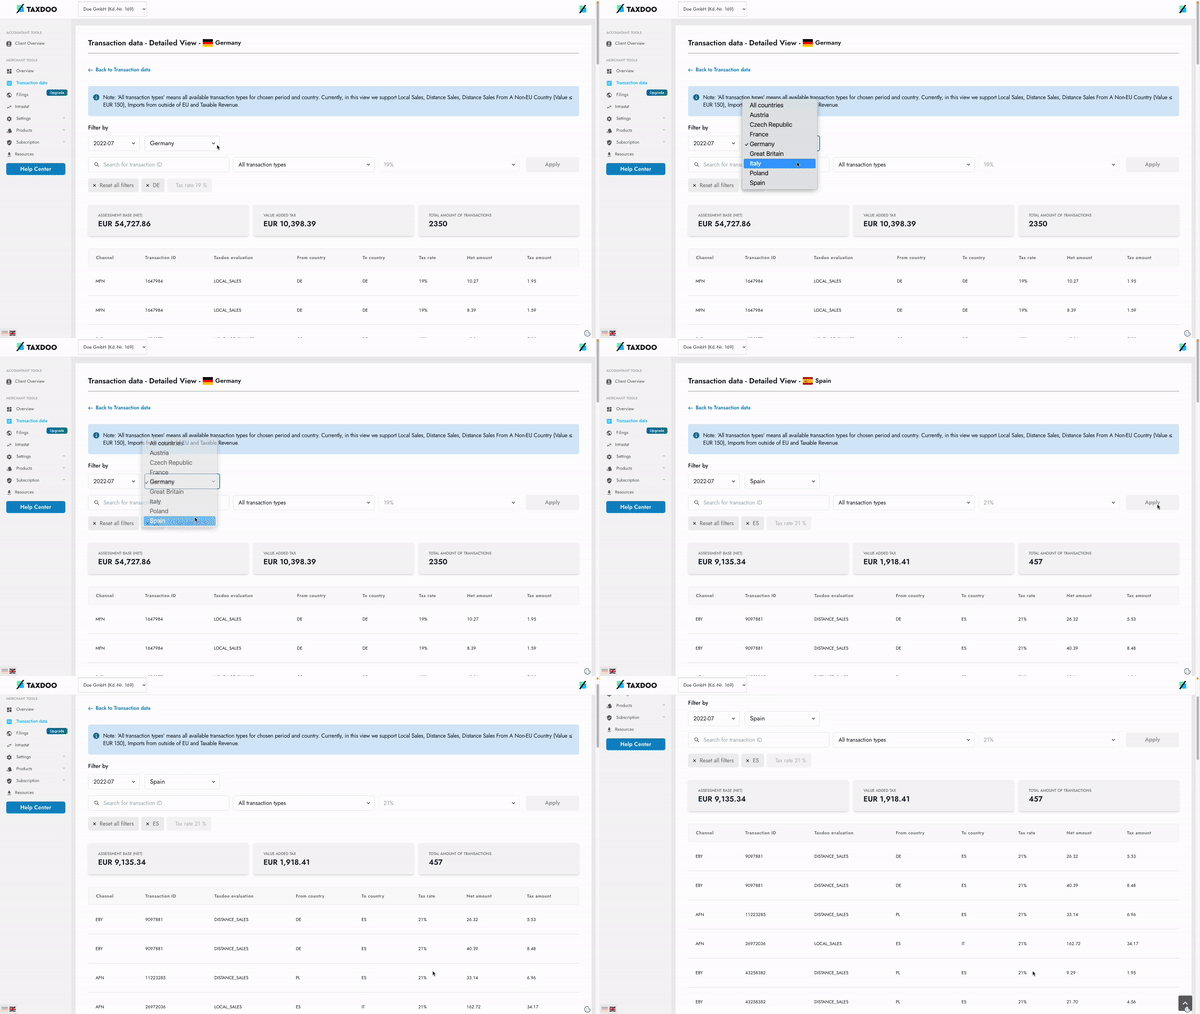
If you want to know the data of other countries just go to the filter, and choose the country you need.
Step 5: Revising the data
Once you have selected the filters you want, all the detailed information will be shown below.
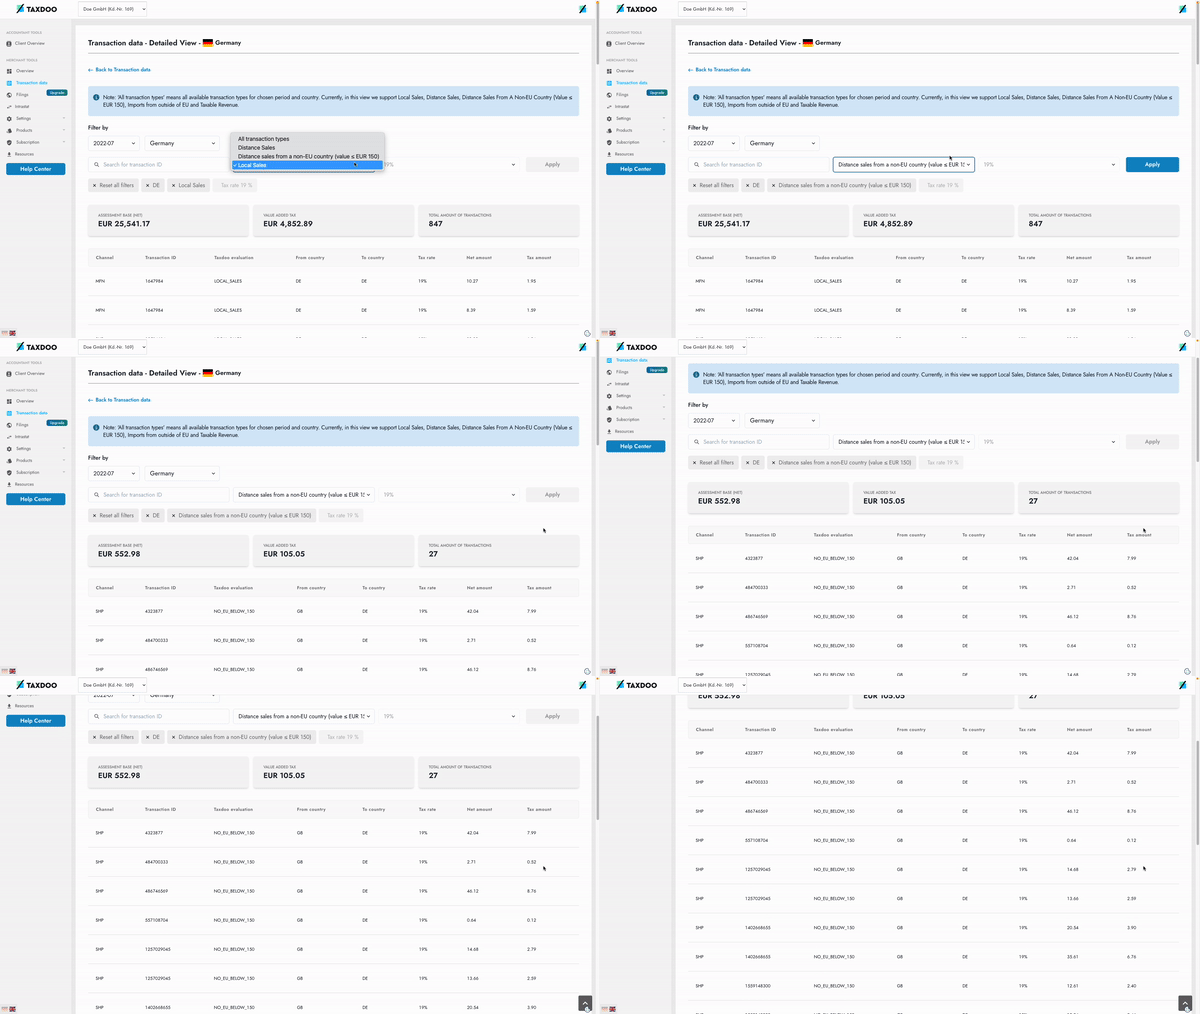
This way you understand the data of the individual transactions even better!
With Taxdoo’s detailed transaction view, you can find the information you need even faster and easier. And understand even better how your figures are made up. So you save a lot of time and are always on the safe side.
Book a demo with our experts!
Explore our YouTube channel and discover important information explained by our experts for tax professionals and online sellers.